

Introducing Location Data in the AI Resilience Report
Product update · July 28, 2026 · 6 min read
Key takeaways
- The report now shows metro-level labor market data for each occupation: how many people do the work in your area, what it pays locally, and how concentrated the job is compared to the rest of the country.
- This data is descriptive context, not part of the resilience score. An occupation's resilience label is the same in every metro today.
- The numbers come from the Bureau of Labor Statistics, cover 847 occupations across 393 metro areas (plus 137 nonmetropolitan regions), and read “No Data” wherever BLS doesn't publish a reliable local estimate.
- This is a first step toward answering a question we raised last quarter: whether resilience itself varies by place.
Last quarter, when we walked through the updated scoring model, we ended by listing the questions we still didn't have good answers for. One of them was geography: Does AI resilience vary by location? If so, how? Does a marketing manager in healthcare in Miami face a different resilience picture than a marketing manager in consumer tech in Seattle, for example?
While we still can't answer these questions, we are taking an early step by introducing occupation-level location data from the Bureau of Labor Statistics (BLS). Now anyone can search occupations by metro area and see where an occupation is actually concentrated, what it pays there, and how big the local workforce is. This data is not integrated into the AI resilience scores.
What we added
The homepage has been updated with a new input field for location, and every occupation page now includes a ‘Local Picture’ module that displays real data for local workforce size, local median salary, and a location quotient.
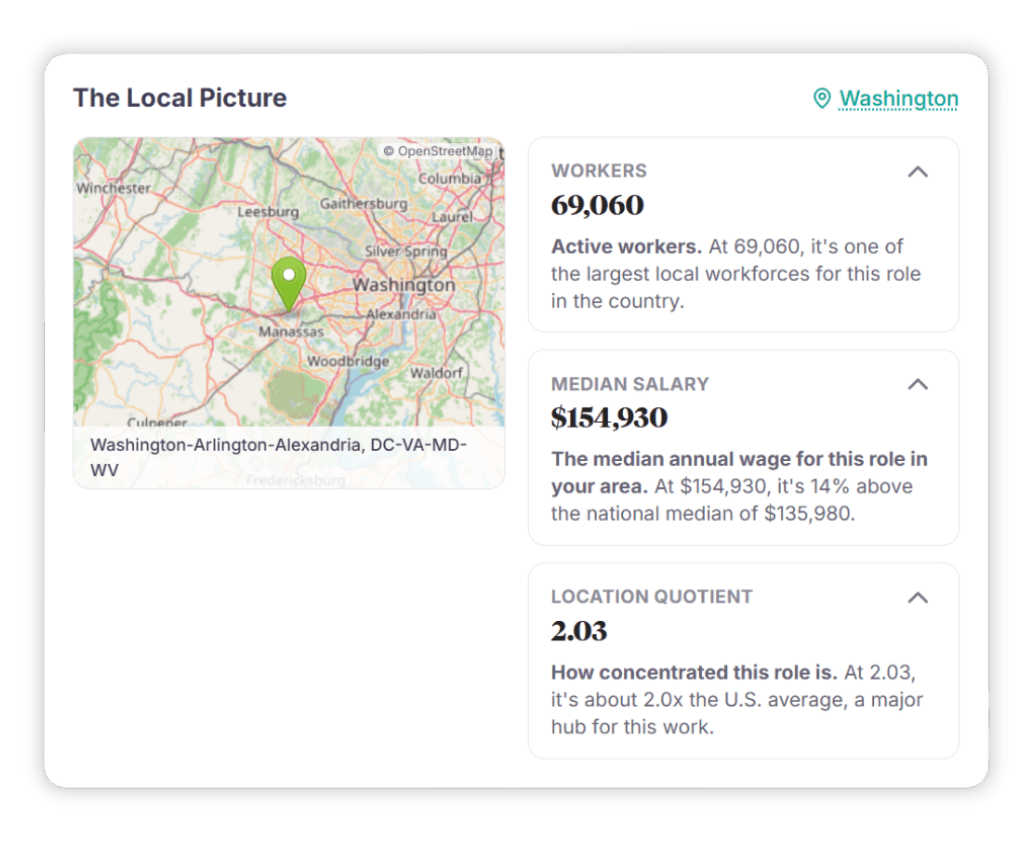
Local workforce size is the number of people employed in that occupation in the metro area, along with how that stacks up against other metros. A count of 69,060 software developers in the Washington DC metro, for instance, tells you it's one of the largest concentrations of that work in the country.
Local median salary is the median annual wage for the occupation in that metro, shown against the national median. In the Washington DC example shown above, developers earn a median of about $154,930, roughly 14% above the national figure of $135,980.
Location quotient measures how concentrated an occupation is in a metro compared to the country as a whole. A value of 1.0 means the metro devotes the same share of its workforce to that job as the nation does. Above 1.0 means the work is more concentrated there; below 1.0, less. In our DC-area software developer example, a location quotient of 2.03 means the occupation is about twice as concentrated in that metro than the national average, making it a major hub for the work.
Why location does not (yet) factor into occupational resilience scoring
Showing a different resilience number for the same occupation in different cities would imply we can measure how AI's impact varies geographically. We can't yet. The AI exposure research underneath the model describes occupations at the national level. We have no credible basis for saying a role is, say, more AI-exposed in Austin than in Cleveland. Publishing city-by-city resilience scores would manufacture a precision the evidence doesn't have.
Still, we do suspect these numbers probably say something about resilience, although we also suspect the relationship isn't simple. For example, a high location quotient tells you a job is concentrated in your metro. If that job is resilient across other dimensions, concentration might work in your favor. But if it's a vulnerable one, a high concentration is likelier to be a concentration of exposure.
The relationship between local pay and resilience is also unclear. Pay already does feed the resilience score: where Manning and Aguirre's data covers an occupation, the adaptive capacity index already takes its earnings into account. But that's pay at the occupation level, nationally. The figure in this module is the same occupation's pay in your metro, and a local premium is hard to decompose. Cost of living is part of it, for example: a high or low cost of living shifts the local supply of and demand for workers, which moves pay too. And we're sure there are other factors.
The data, and its limits
The geographic data comes from the Bureau of Labor Statistics' Occupational Employment and Wage Statistics program, which publishes employment counts, wages, and location quotients by metropolitan area. It's the standard source for this kind of information, and it's the same underlying dataset that feeds other signals already in our model.
It also has a few important limits.
BLS doesn't publish an estimate for every occupation in every metro. When a local sample is too small to produce a reliable figure, or when publishing it could identify a specific employer, BLS suppresses the estimate. Where that happens, the module reads “No Data” rather than showing a guess. This is more common for smaller or highly specialized occupations, and for smaller metros.
A few other caveats come with OEWS data. Metro areas follow federal Metropolitan Statistical Area definitions, so the geography of “your area” is drawn by the government, not by commute times or how you'd describe your region. Estimates are updated on the BLS release schedule, so the local picture reflects the most recent published survey rather than this month. And the report's “all other” occupation categories, which bundle several related jobs under one code, carry the same blurriness locally that they do nationally.
What's next
The open question we started with remains open. Whether resilience genuinely varies by place is something we want to answer well, but a real answer would need to account for things this first layer doesn't touch: the mix of industries in a region, how much of an occupation's work can be done remotely, and whether local exposure to AI actually diverges from the national picture in a measurable way. Those are hard problems, and we'd rather get them right than rush a number onto the page.
If you're using the local data in advising, in the classroom, or for your own decisions, tell us what's helping and what's missing. Reach us at air@careervillage.org.


